What "Average Patio Cost" Benchmarks Miss About Regional Pricing
Labor rates, materials, and site conditions all swing wildly by region—not the national average.

National patio benchmarks tell you what the average job costs across the whole country. They don't tell you what your job costs in your zip code, with your labor market, your soil, your permit office, and That gap between national benchmark and local reality is where margin gets lost and bids go sideways.
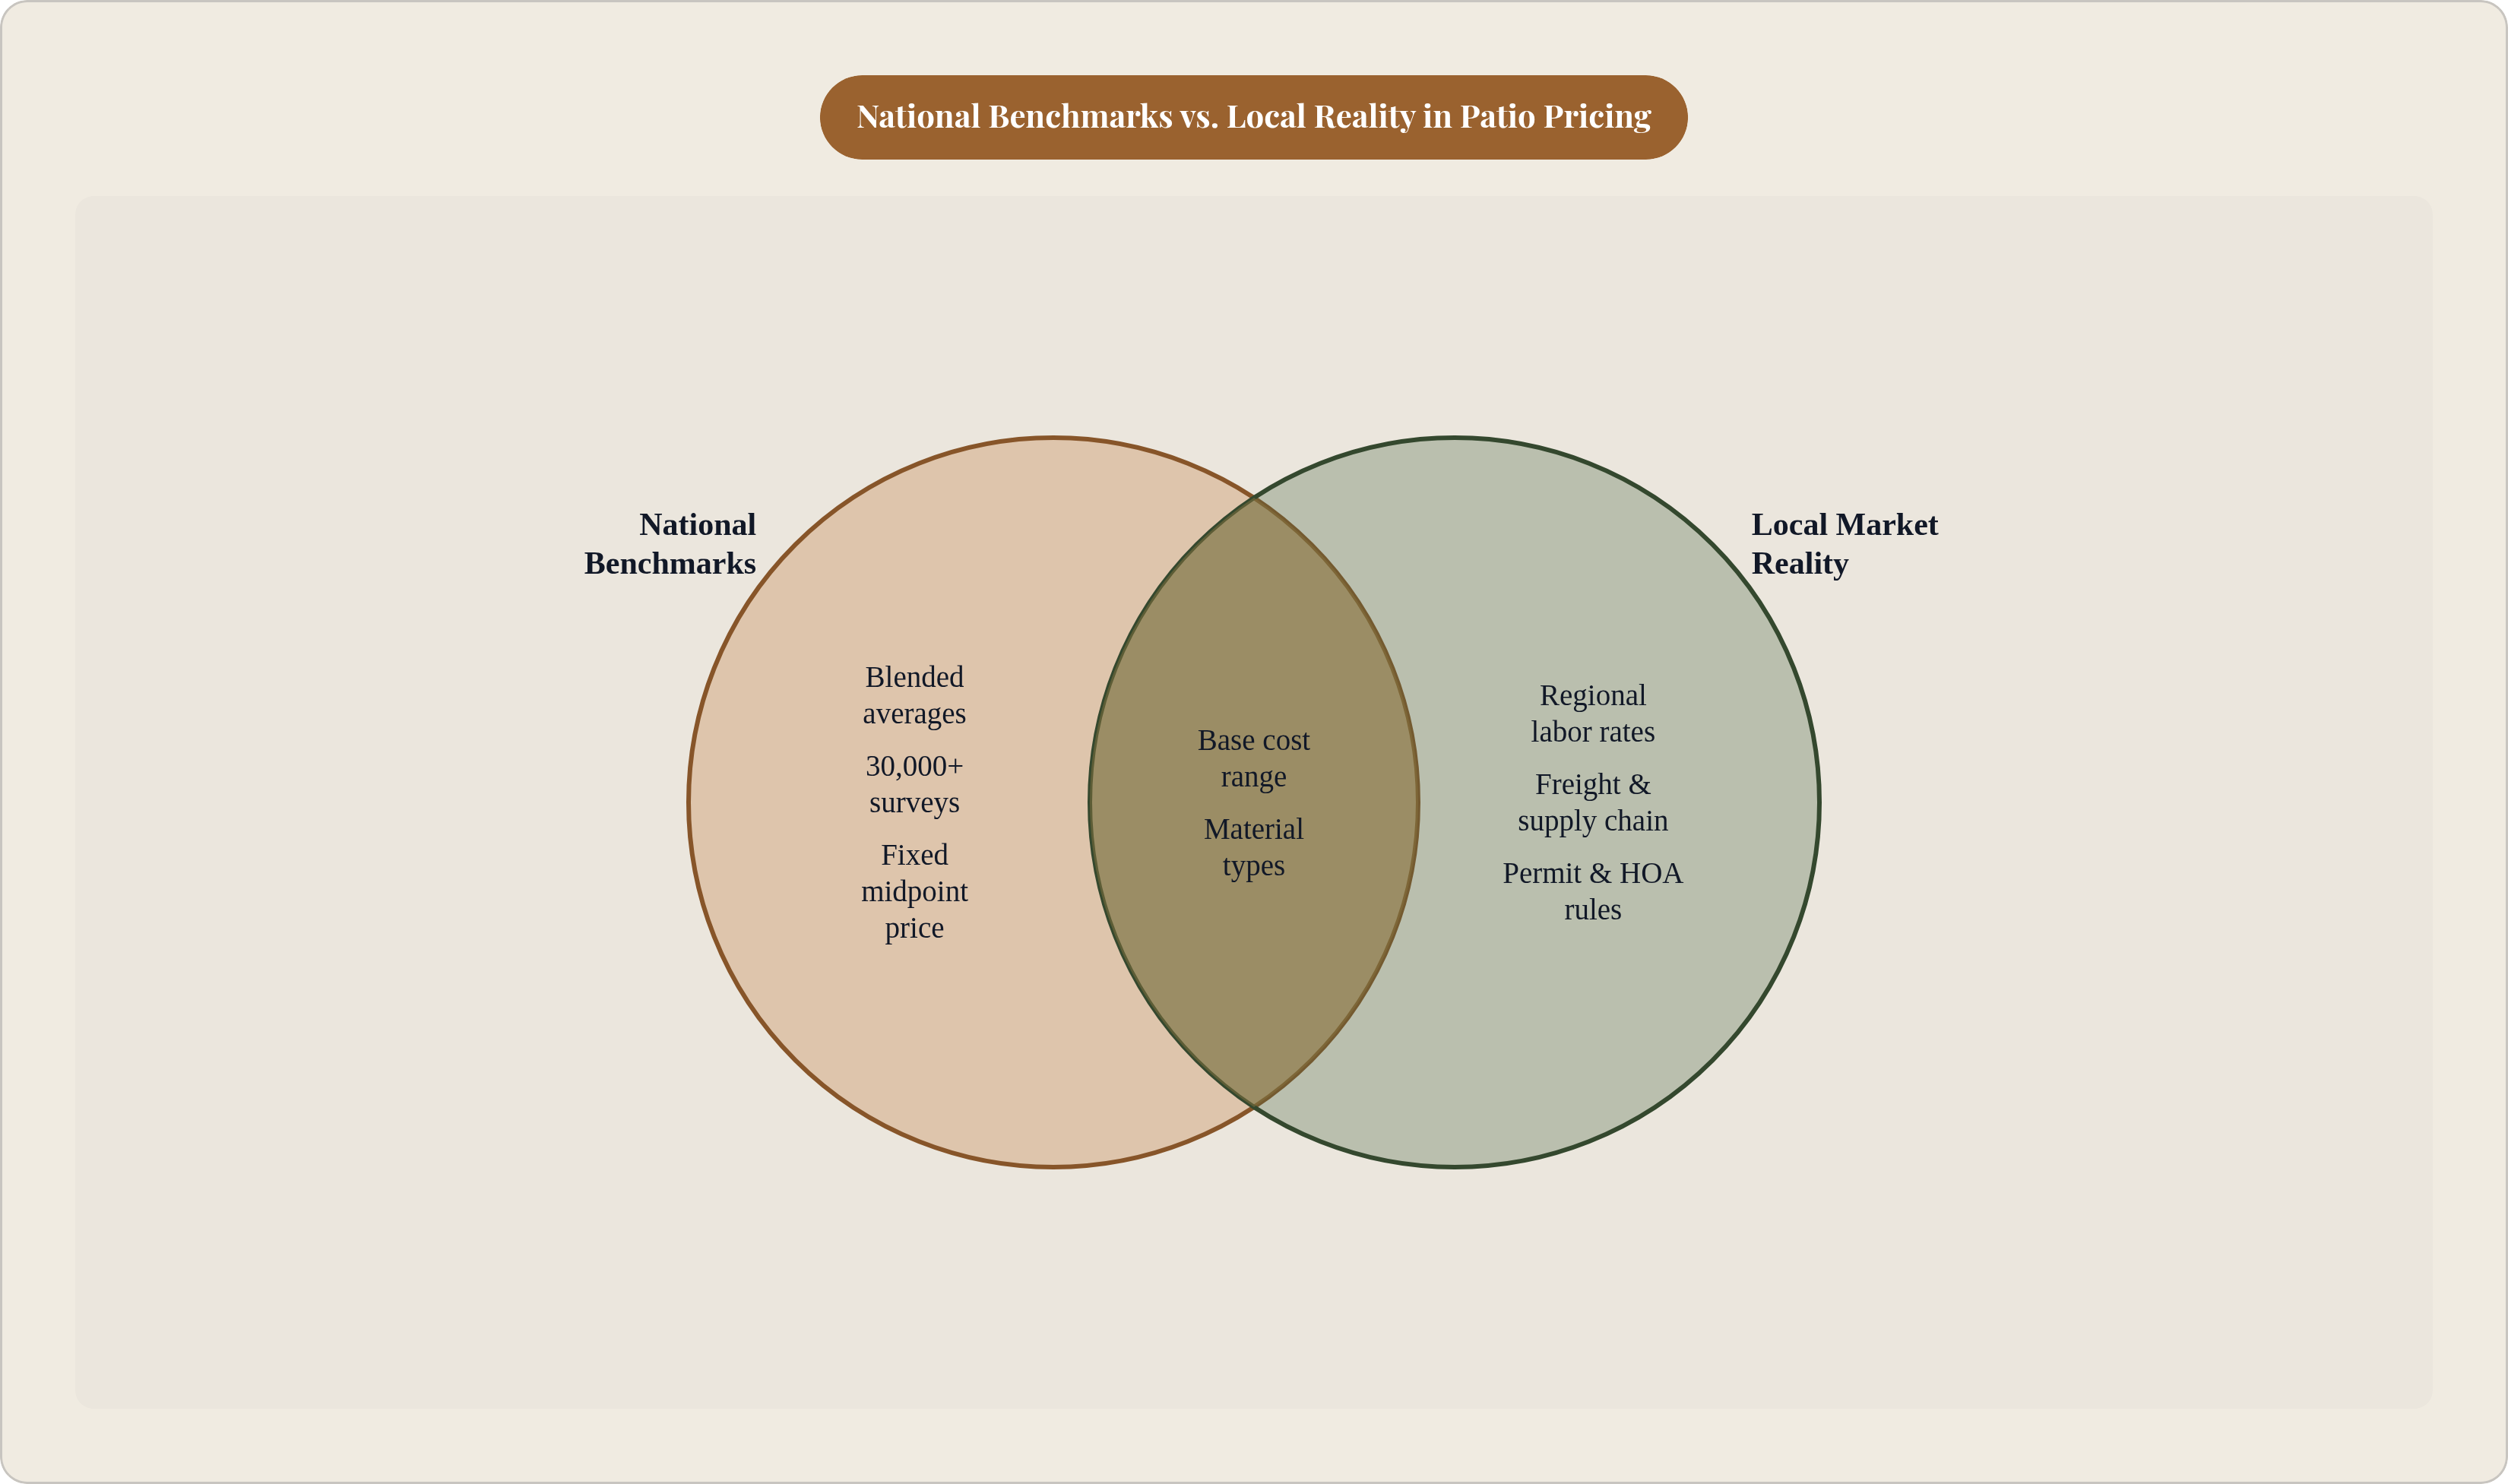
Here's the number most homeowners, and plenty of contractors, start with: $4,005 national average, a typical range of $2,028 to $6,088, and a per-square-foot range of $5 to $50, according to HomeAdvisor's data pulled from over 30,000 customer surveys. For paver patios specifically, the commonly cited range is $12 to $28 per square foot. That's a spread of more than 100% before a single regional variable even enters the picture.
These numbers come from huge survey pools, cross-referenced across HomeAdvisor, Angi, Houzz, Thumbtack. Even the more careful calculators require a minimum of 50 verified project reports per material type per year, spread across at least 8 US markets. It's a blended, smoothed figure by design, and the math spits out a midpoint that's accurate for the national middle and misleading almost everywhere else.
"Average" quietly assumes a moderate labor market, materials that are locally available, a flat and accessible site, standard base conditions, and all four are rarely true at once. When they're not, the benchmark stops being a price and starts being a guess.
These numbers aren't wrong. They're right for a market that may not exist in your zip code.
How far labor costs alone can move a quote off the national baseline
Labor is the line item national averages flatten hardest. Techo-Bloc puts construction crew labor rates nationally at $50 to $120 an hour, but that range isn't spread evenly across the map (not even close).
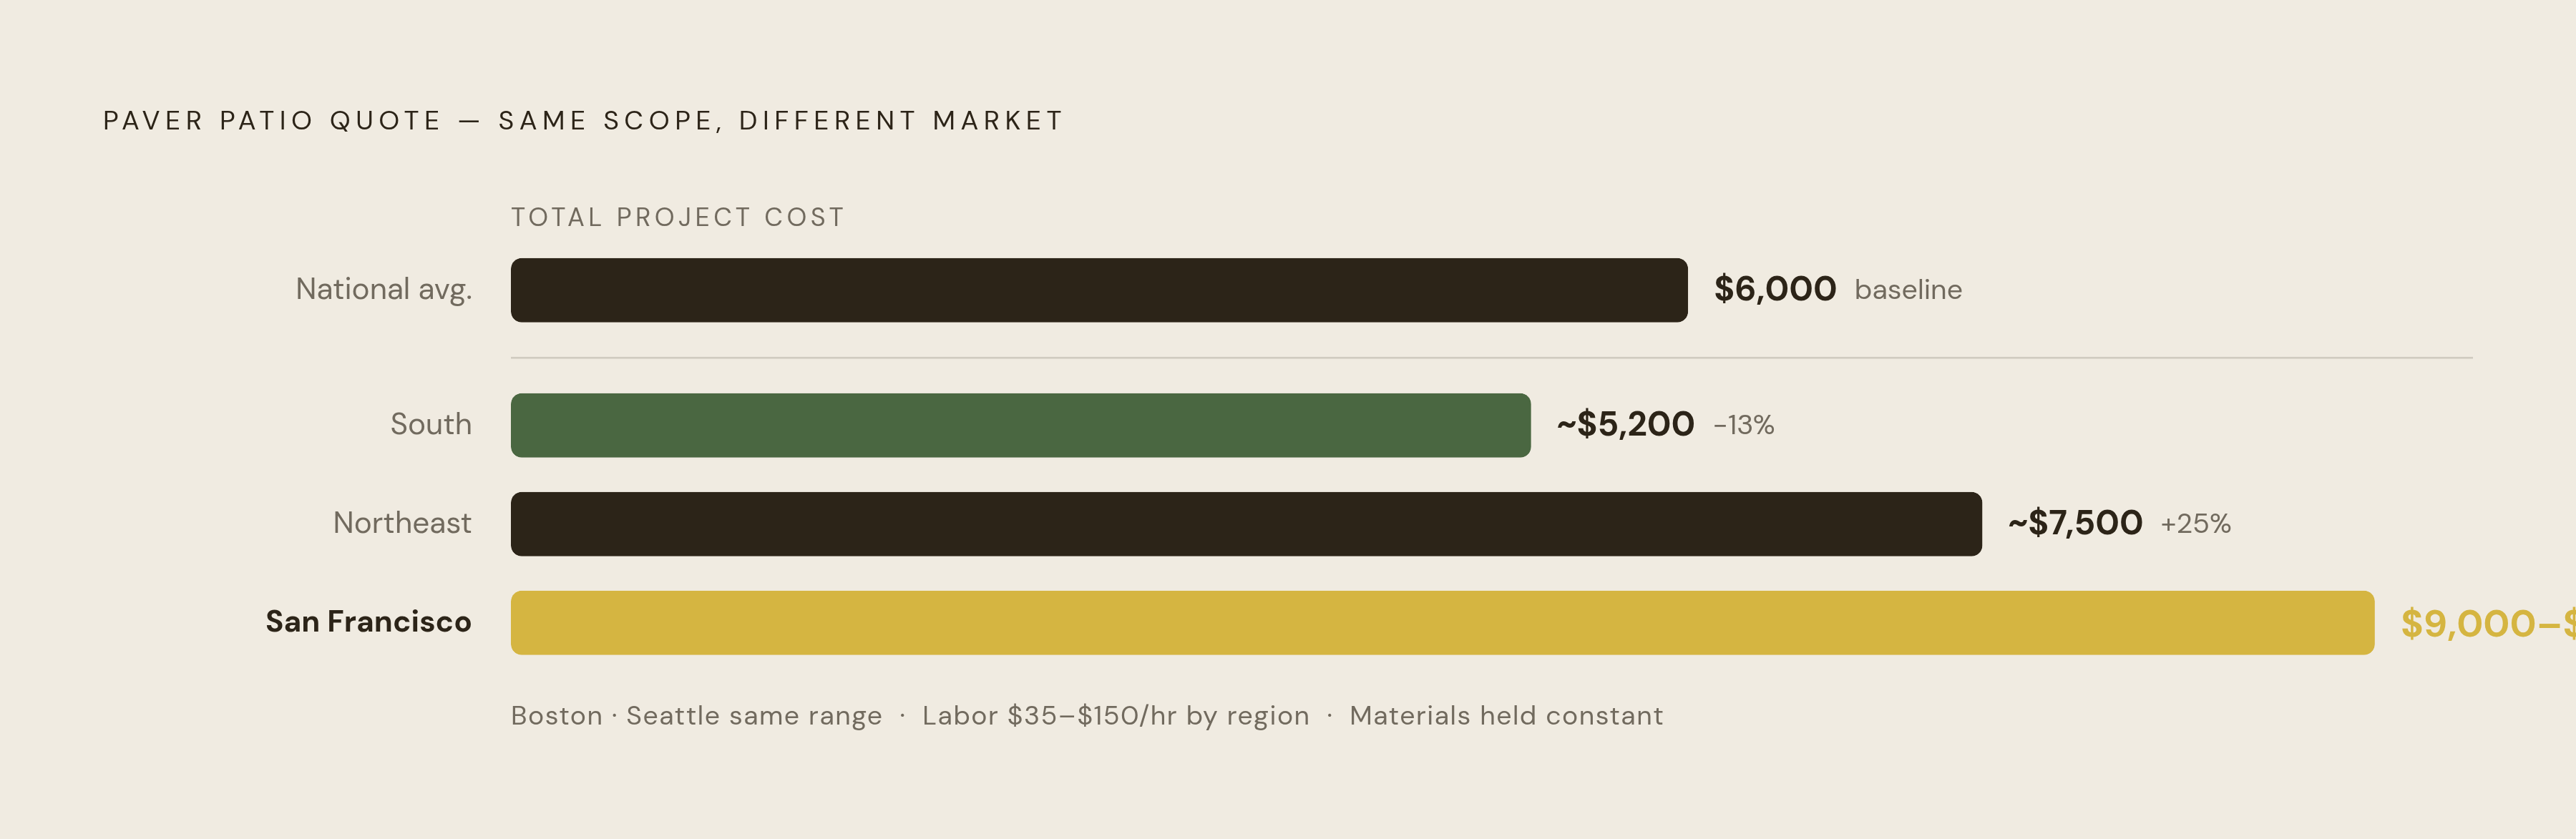
In the South, installation labor runs $35 to $81 an hour. In the Northeast, it runs $50 to $150. San Francisco, Boston, and Seattle sit 35% to 50% above the national average; the Boston-to-New York corridor runs 25% to 35% above it. Same trade, same skill, wildly different cost of doing business depending on where the crew clocks in that morning.
According to Constructly Tools, a $6,000 contractor-installed paver patio, priced at national-average labor, turns into a $9,000 to $10,000 quote in San Francisco with the exact same scope and materials. That's 50% to 67% more expensive, purely from geography, nothing else.
A contractor in a high-labor market who prices off the national benchmark is either giving up margin or giving up the bid. There's no third option; the math just doesn't leave room for one.
None of this is random, either, since labor variance tracks cost-of-living pressure on crews rather than some fixed wage floor. Benefits, insurance, overhead, all of it scales with the same regional forces pushing hourly rates up or down.
Material costs and what regional supply chains add to the base price
Material prices move by region for reasons that have nothing to do with labor at all. Quarry access, transportation distance, distributor density: these move independently of wages, and they hit the estimate just as hard.
Specify a material that isn't locally sourced, and freight becomes a real line item — a premium that gets tacked on and stays invisible in every national benchmark you'll find.
2025 added its own pressure on top of that. Rising fuel and delivery fees pushed freight costs up broadly, and Techo-Bloc flagged an upward trend in late 2025 for crushed stone and concrete pavers specifically. Supply chain normalization from 2024 offset some of it, but the upward trend in those materials remained.
Nobody puts the base material cost on a flyer, either. A 300 square foot paver patio needs roughly 7 tons of compacted gravel, running $280 to $420, plus 1.5 tons of sand at $80 to $130. That's $360 to $550 before a single paver goes down, and no "price per paver" figure on any benchmark site accounts for it.
Regional material pricing compounds with freight and base costs. Stack those together and the floor for a job can sit above the national benchmark before anyone's even picked the surface material.
Site conditions that add costs no regional average can anticipate
Region and site conditions are the two biggest sources of estimate variance, and they don't just add together, they multiply. That interaction is where estimates blow up.
Grade is the clearest example. Raised patios run $9 to $55 per square foot, which is $4 to $15 more per square foot than ground-level work, and that premium reflects the added complexity of elevated construction. Lawn leveling adds $500 to $1,000 on a manageable site; on a heavily sloped or drainage-compromised lot, that number climbs to $5,000.
Access constraints matter too, and they're almost never priced right on a first pass. Narrow gates, mature landscaping, no room to stage equipment: all of it eats labor hours, and none of it shows up in a benchmark.
Soil is the quiet one. Poor drainage or expansive soil means deeper base prep, and that cost stays invisible until the crew starts digging and finds out the hard way. Design complexity adds its own tax on top of that: intricate patterns like herringbone or custom cuts can add 15% to 25% to labor costs, same material, same region, completely different price.
A site visit is the only way to price a job accurately, full stop, since the benchmark starts the conversation but doesn't get to end it.
How permit costs and local regulatory requirements create a fourth pricing layer
Permit rules for patios vary by municipality, not just by state, and a contractor working across several nearby markets is navigating different regulatory baselines whether they realize it or not.
Where permits are required, that's a real cost added to the total. Where inspections drag out the timeline, labor costs can climb too, especially if a crew has to come back after an inspector flags something. HOA restrictions and local zoning can add another layer in plenty of markets, constraining what a homeowner can actually build regardless of preference.
None of this shows up in a national benchmark. It's local, it's variable, and it's on the contractor to know it cold.
A contractor who bakes permit costs into proposals in a heavily regulated market, and skips that step in a lightly regulated one, is already doing regional pricing. They're just doing it informally, by feel, without a system behind it.
What local demand conditions do to pricing power, independent of cost
National benchmarks are cost averages, and they say nothing about what homeowners in a given market are actually willing to pay, which is a completely different number.
Demand for outdoor home improvement is running high heading into 2026, and that tailwind doesn't lift every market by the same amount. Local competitive conditions shape what the market will actually bear, independent of what costs alone would suggest.
The data backs this up. Jobber's Home Service Economic Report, drawing on data from over 350,000 service professionals, found green businesses saw a 19% jump in December job volume and a 5% rise in average invoice size, adding up to 10% revenue growth in late 2025. That demand is real, and it's recent.
A contractor in a high-demand suburb outside a major metro might price above even the labor- and material-adjusted rate and still win the job. But that only works if they know their local market, not the national one. Flip it around: a contractor in a slower market pricing at the top of the national range on quality grounds loses, every time, to a local competitor who actually knows what the market will bear.
Why contractors who rely on national benchmarks lose on both ends of the margin problem
There are two ways this goes wrong, and they're mirror images of each other.
Underpriced: a contractor in a high-labor, high-material, high-permit market quotes off the national average. They win the job but lose the margin, because every variable that came in higher than the benchmark predicted gets absorbed by the contractor, not passed to the client. The number was already quoted; there's no going back.
Overpriced: a contractor in a genuinely lower-cost market quotes near the top of the national range because "that's what patios cost." They lose the bid to a local competitor who knows the real floor sits lower, and they never even find out why the job went elsewhere.
The benchmark actively misleads, in one direction or the other, depending on where the contractor happens to be standing. And the variables driving that gap (labor markets, freight, site conditions, permits, demand) aren't hidden information. They're knowable, just not written into the benchmark anywhere.
A contractor who's done 20 jobs in their own market already holds better pricing data than any national survey could hand them. The gap isn't information; it's systems. Most contractors know their real numbers instinctively but never write them down in a form they can actually reuse from job to job.
Winning quotes are calibrated to the actual cost structure of the actual job in the actual market, not set by habit at the national average or some fixed markup above it, and getting that calibration right is most of the job.
How to build a regional pricing baseline that accounts for what the benchmarks miss
Start with labor. It's the single highest-leverage input in the whole estimate, so know the prevailing crew rate in your market cold, and don't reach for the national range when you already have better data sitting in last month's payroll.
Build a material cost index for the project types you run most often. Price the base, gravel and sand, as a fixed line item per square foot rather than something tacked on at the end as an afterthought. Track freight premiums separately on anything that isn't sourced locally, and update the whole index whenever fuel costs or supply conditions shift, because 2025 proved material prices can move fast in a short window.
Then build a site-condition multiplier right into the estimate template. Grade complexity, flat, moderate slope, significant grade, carries a known labor premium at each tier. Access difficulty, standard versus constrained, affects equipment and crew time in a fairly predictable way. Pattern complexity, standard versus intricate, carries that 15% to 25% labor adder mentioned earlier, and it's a real, applicable figure, not a guess pulled from thin air.
Permit costs by municipality should live in your estimate template as a lookup, not something you re-derive every single time you bid. And track your own closed jobs like a dataset: what you actually spent versus what you quoted is better regional pricing data than any national survey blending 30,000 projects from markets you've never once worked in.
Quoting tools that start from regional labor rates, real material cost inputs, and job-condition adjusters solve this at the point of estimate instead of after the job's already underwater. A quoting tool built on that logic lets contractors price from their own cost structure instead of a blended national number that was never describing their market to begin with.
The contractor who can look a homeowner in the eye and explain exactly why the quote is what it is (the local labor market, the material sourcing, the site itself) wins the trust. More often than not, they walk away with the margin that comes with it too.