Closing Rate Benchmarks for Hardscaping Companies
Process speed and automation, not pricing, separate hardscaping closers from the rest.
Most owners who look at a low close rate land on the same conclusion: the price is too high, the competition has a better portfolio, or the market is just rough right now. That instinct is understandable. It is also almost never the right diagnosis.
The spread between average and top-performing hardscaping companies lives almost entirely in what happens operationally between the moment a lead comes in and the moment an estimate reaches the homeowner. Not the bid number. Everything around it.
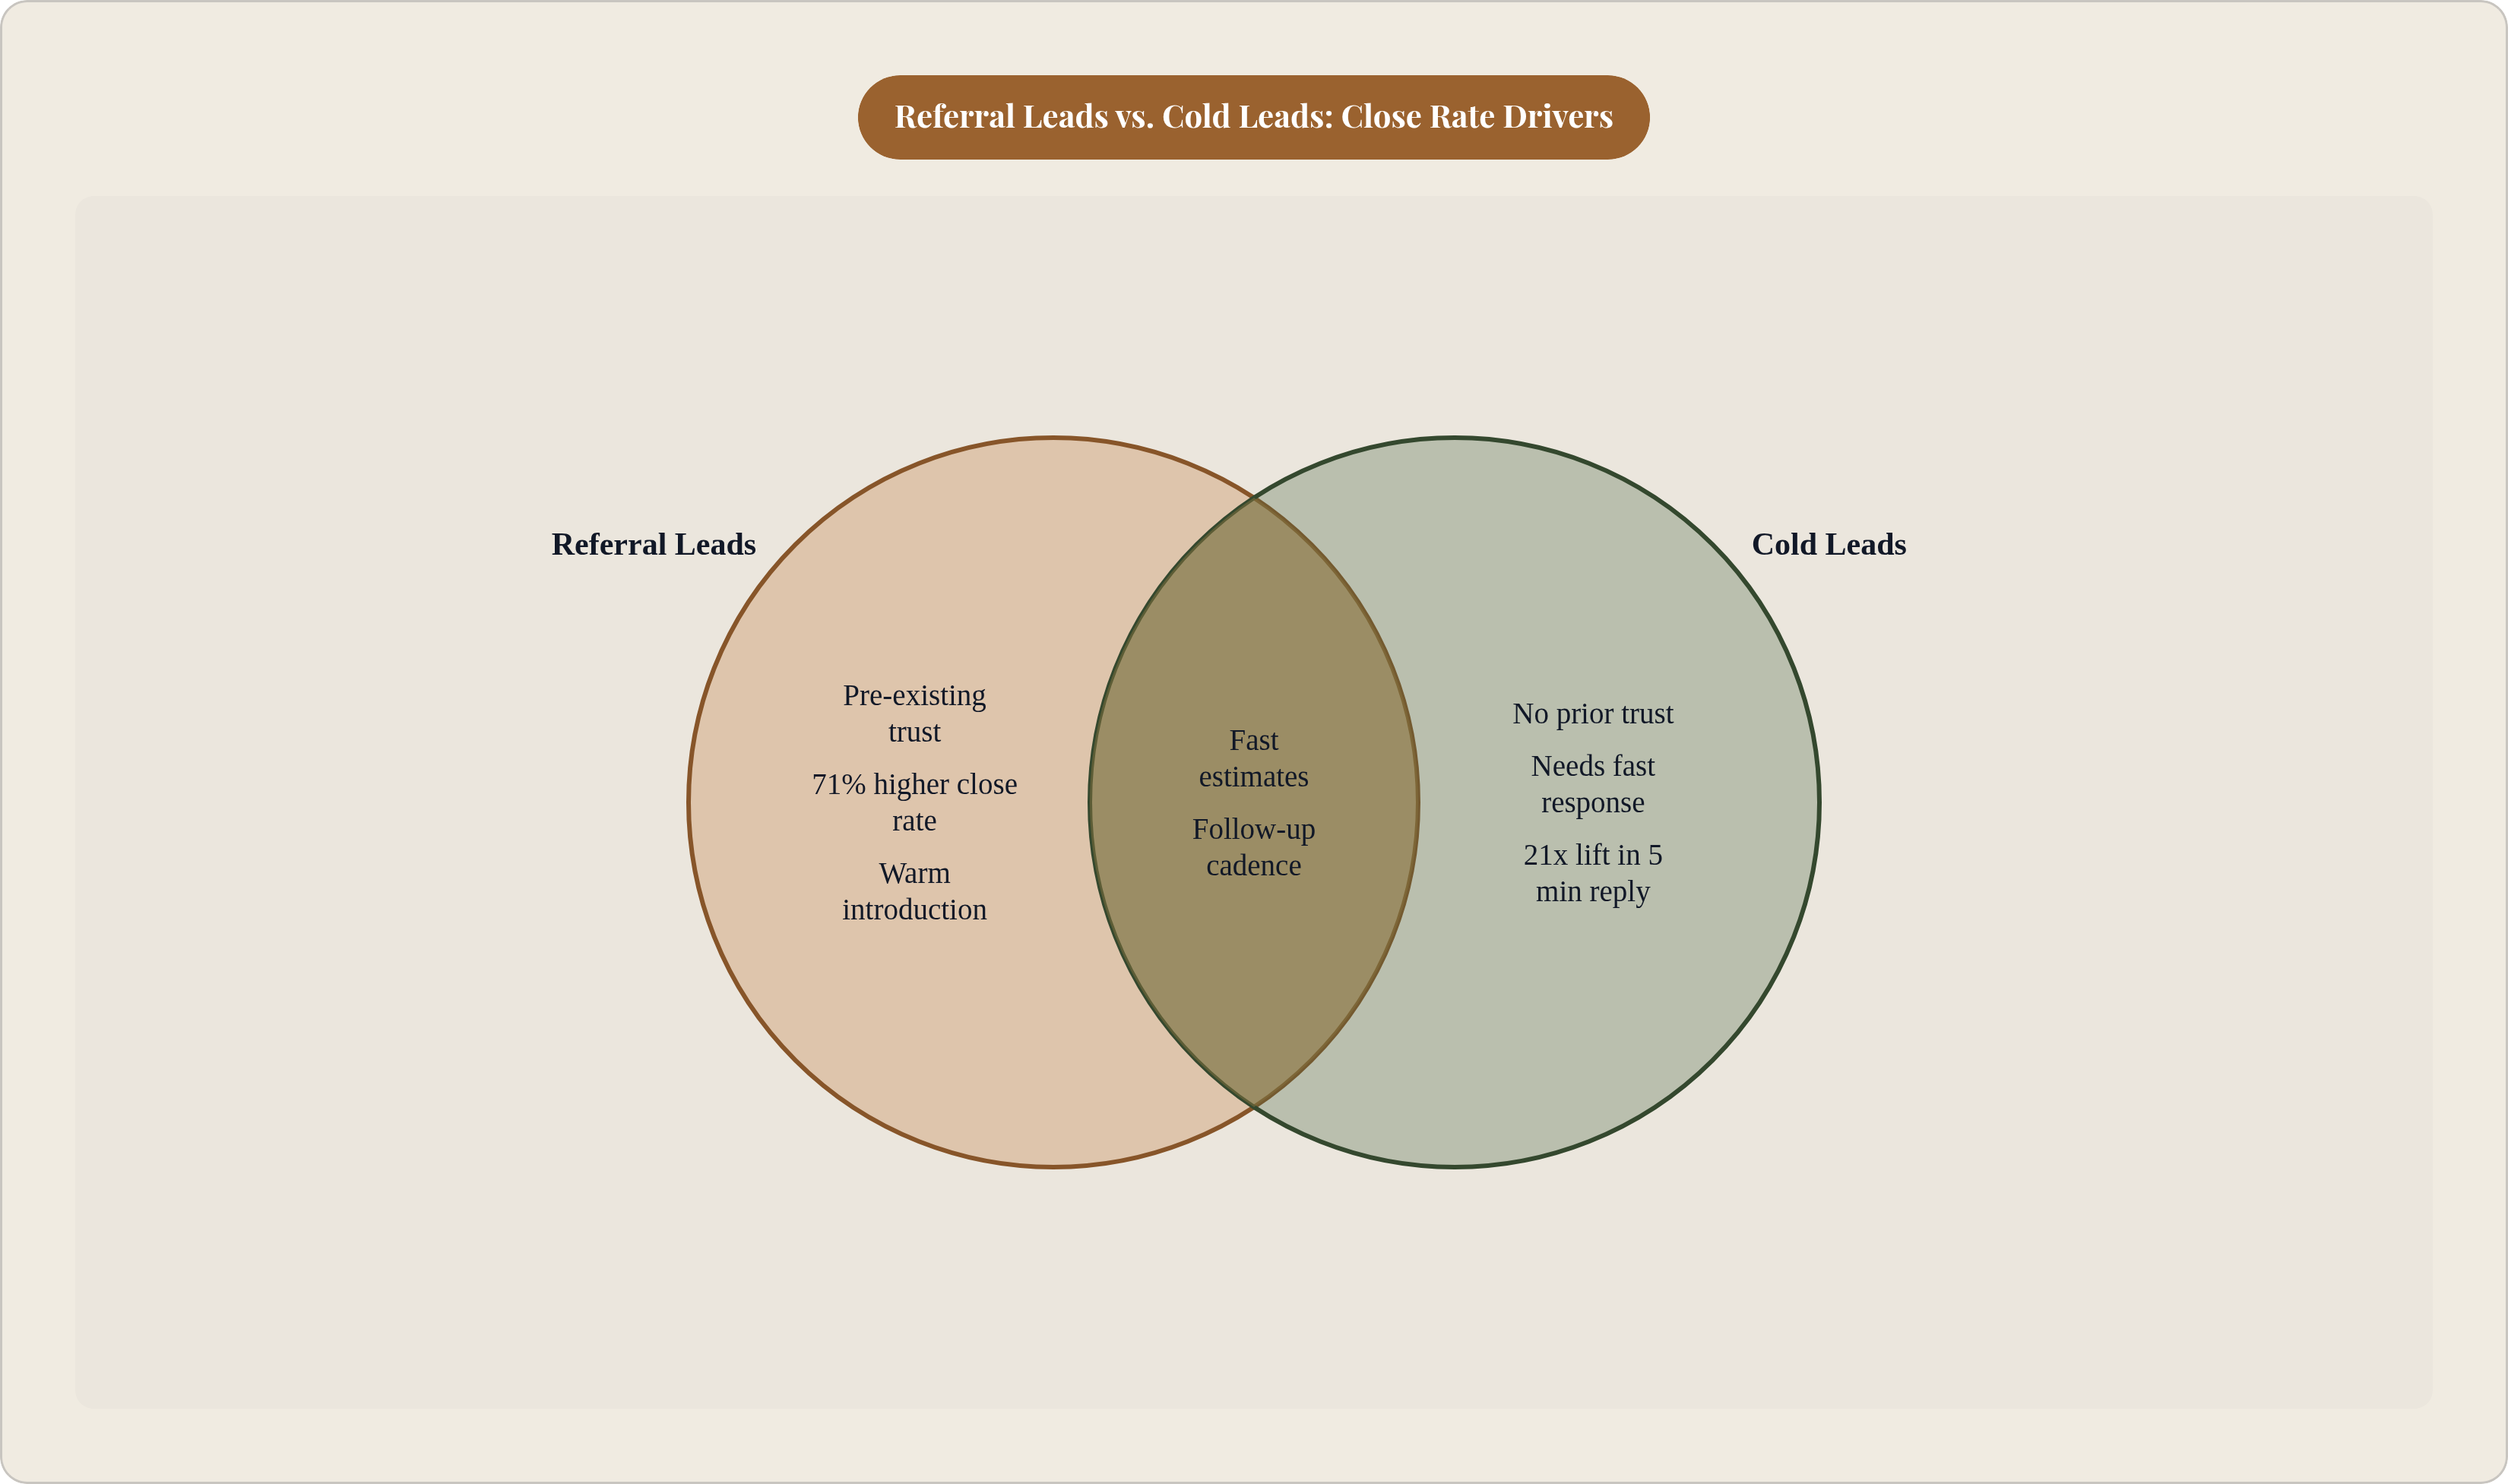
Referral leads make this concrete. The NALP 2025 Benchmark Report shows they close at a 71% higher rate than leads from other channels, and it is not because prices drop on referral jobs. The portfolio photos are the same. What is different is that trust exists before the first phone call. The prospect is further along mentally, and the whole exchange has a different texture: reliability, responsiveness, the sense that this company has its act together. A fast, well-organized estimate can create that same signal for a cold lead — think of it as bottling the warmth of a personal introduction and handing it to a stranger. That texture is manufactured by process.
The same report found that more than half of landscaping and hardscaping customers who switched companies cited slow or inaccurate initial estimates as the primary reason. Not price. Not schedule. The estimate itself. Which means a significant portion of lost jobs are decided before the homeowner ever scrutinizes a line item. They have already formed a judgment about how it would feel to work with you, based on how the early process felt. That judgment forms fast and it sticks.
The controllable variables are response speed, estimate delivery time, and follow-up consistency. These are sequencing problems, and sequencing problems have sequencing solutions.
The 25-Point Gap That Estimate Timing Creates
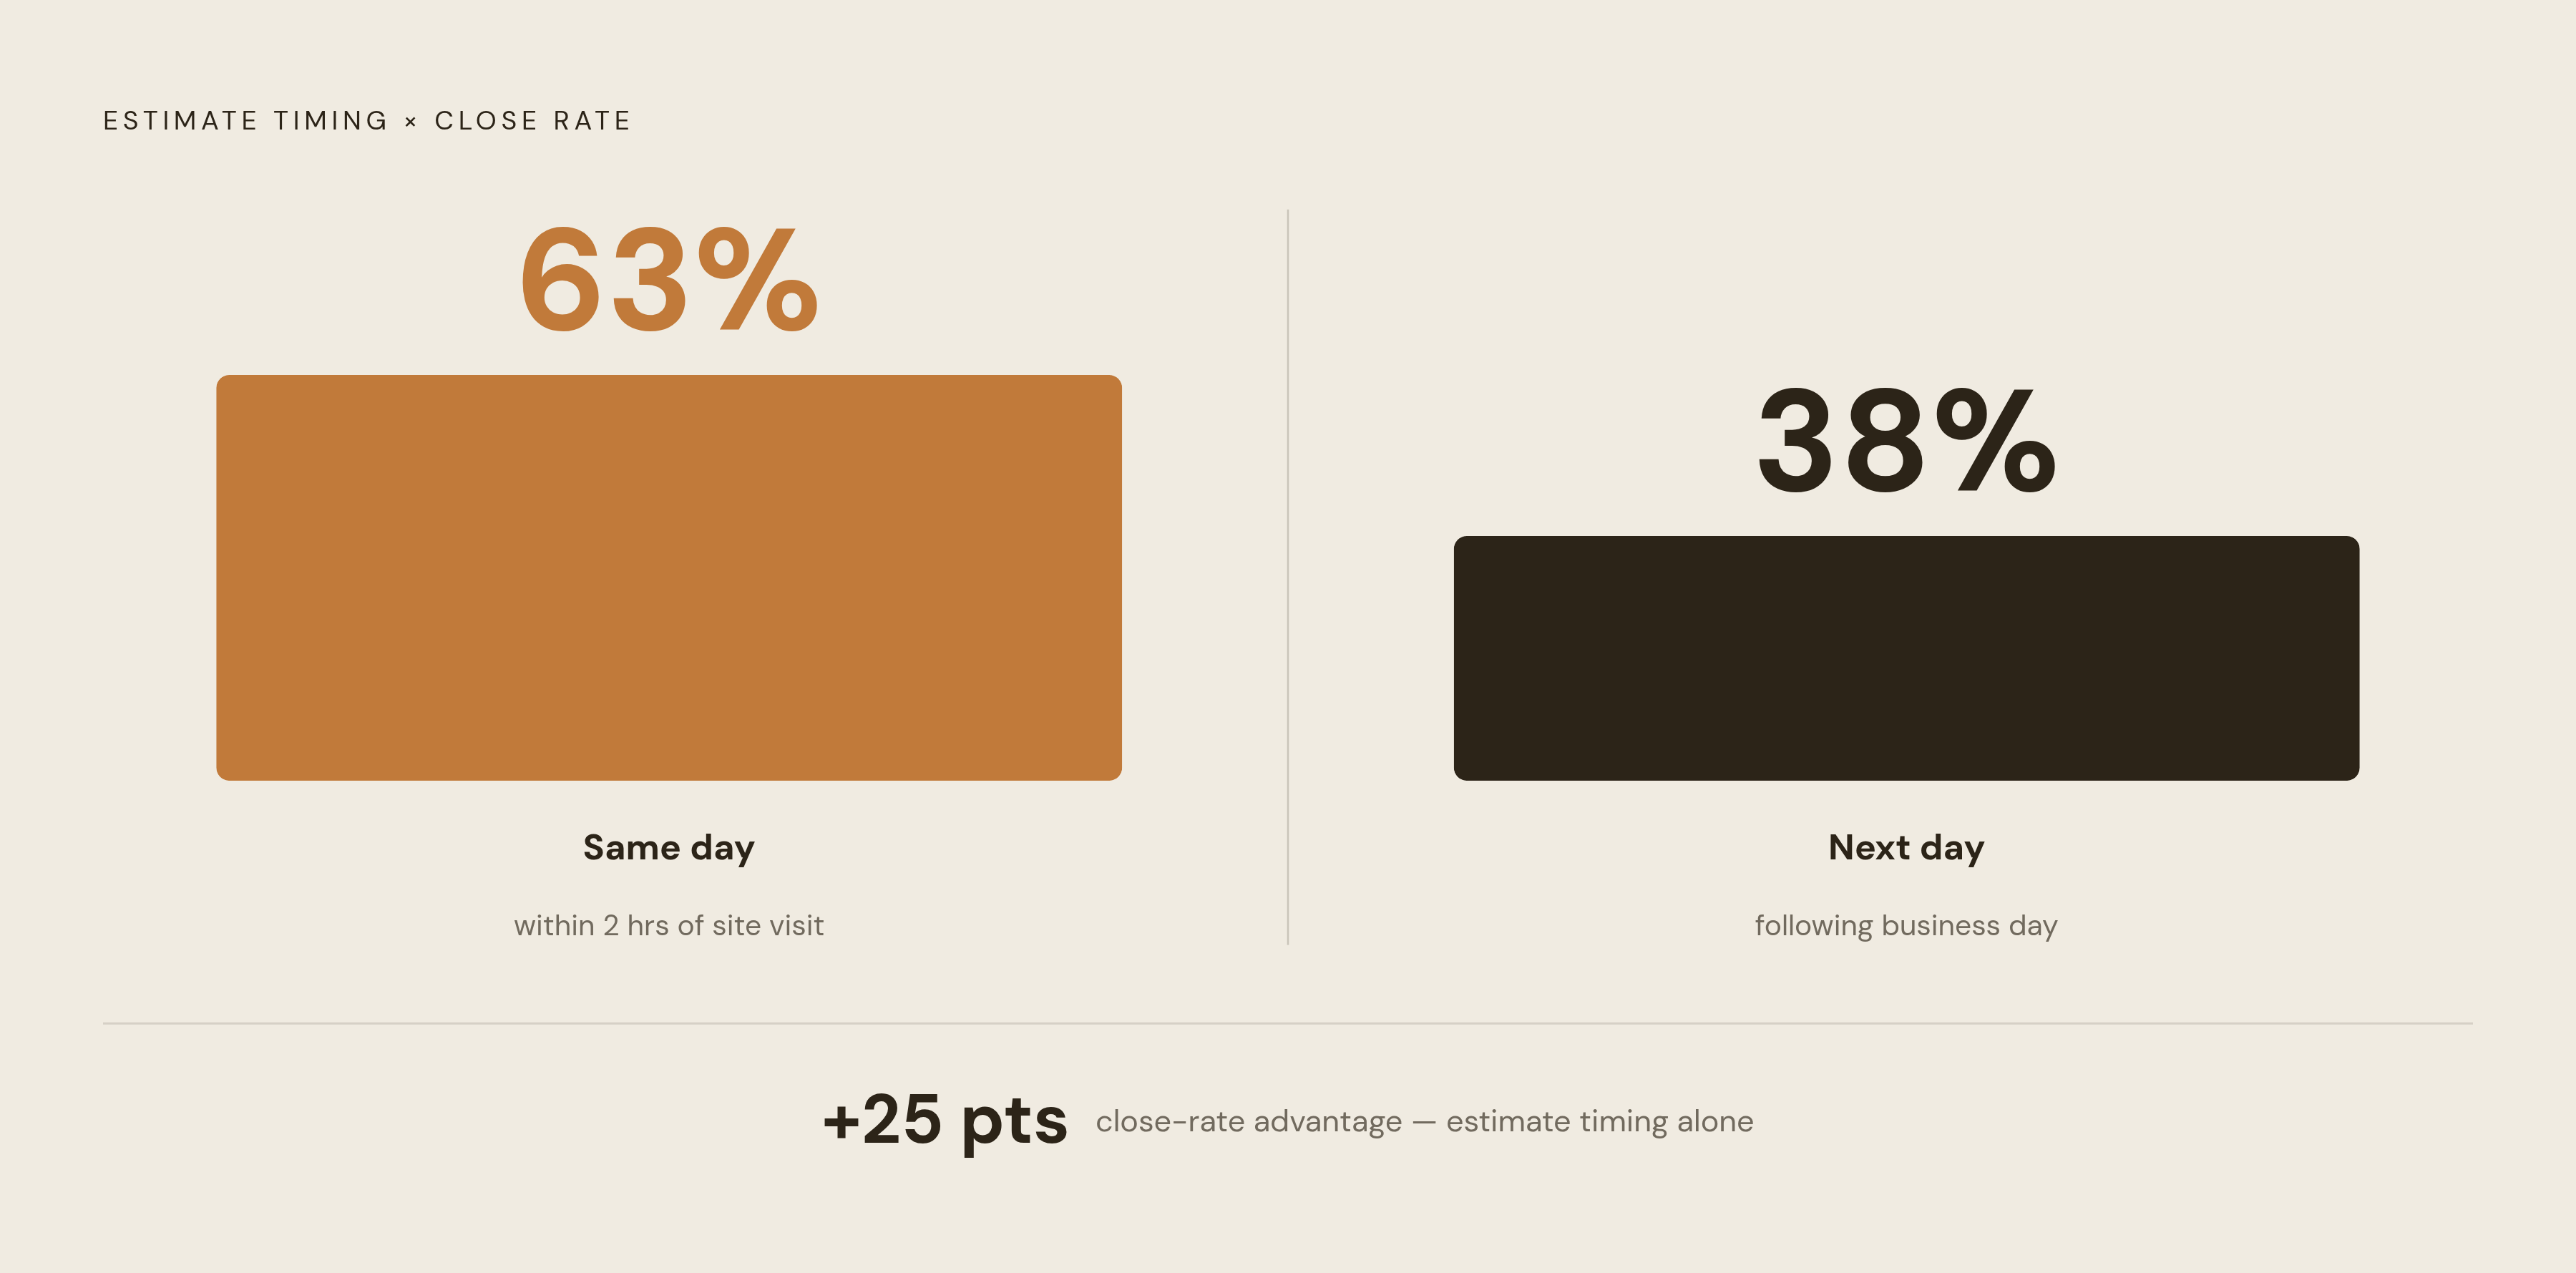
NALP's 2025 Benchmark Report found that hardscaping companies delivering estimates within two hours of a site visit closed 63% of those bids. Companies sending estimates the following business day closed 38%. That is a 25-point gap, entirely from timing.
If you have ever walked a backyard with a homeowner and felt the energy in that conversation, you already understand the mechanism. Buying intent peaks during and just after that visit. They are picturing the patio. Debating where the fire pit goes. Every hour that passes without an estimate is a door left open for doubt to walk through. A same-day estimate intercepts that window. A next-day estimate concedes it, politely.
The same dynamic appears earlier in the funnel. HubSpot's 2024 data shows that responding to an inbound inquiry within five minutes makes a prospect 21 times more likely to qualify than waiting 30 minutes. Seventy-eight percent of consumers buy from the first company that responds. Being first to respond and first to estimate is a structural advantage that has nothing to do with the quality of the stonework.
Two hours from site visit to delivered estimate is the target. Next business day is the baseline top performers have already moved past.
What the Estimating Process Looks Like Inside Companies That Hit the Higher Close Rates
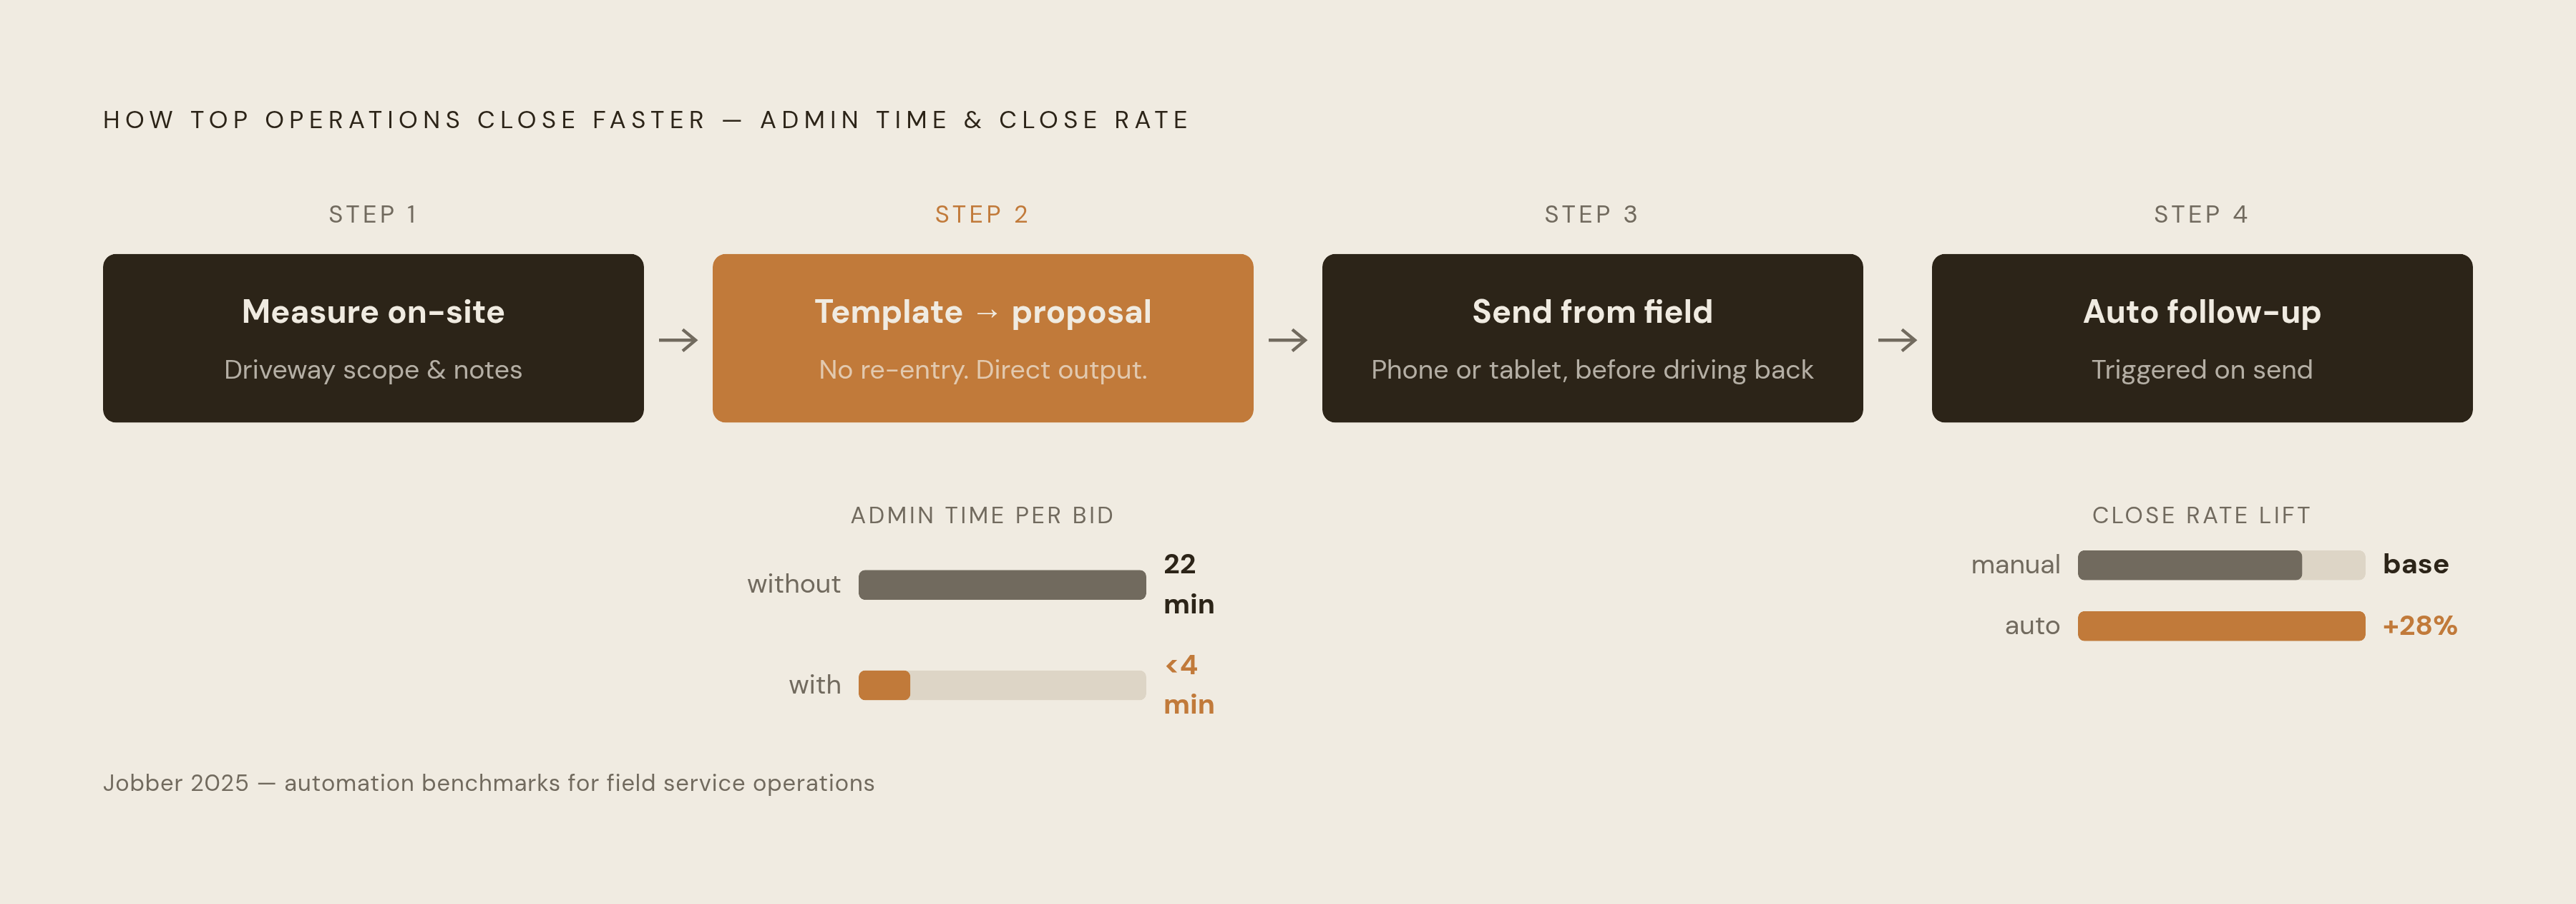
The 63% close rate does not come from faster humans. The instinct is to assume those operators are more disciplined or more energetic, working longer hours with sharper hustle. That is not what is happening. They have built a process tight enough that speed is a routine output rather than an occasional feat.
A few things appear consistently inside high-closing operations. Measurements and scope notes get captured on-site, in the driveway, not reconstructed later from memory or a photograph taken mid-stride while walking back to the truck. Estimate templates or configured software convert those inputs directly into a formatted proposal, eliminating the re-entry step that eats the afternoon. The proposal goes out from the field, from a phone or tablet, before the estimator has driven back to the shop. And follow-up is triggered automatically after the estimate sends, not left to the estimator's memory during a packed week.
Jobber's 2025 State of Home Service report found that companies using platforms with online approval and automated follow-up close 28% more of their estimates than those without. The infrastructure produces a measurable result. NALP's 2025 Benchmark Report puts the administrative cost of a bid without automation at around 22 minutes of re-entry and clerical work per proposal; with automation, that drops under four minutes. The owner is working the same hours. The process has stopped working against them.
One independent operator documented in a third-party case study booked 75% of inbound calls into appointments, converting 90% of those appointments to jobs. The attributed driver was systems, not brand recognition or salesmanship. That outcome is repeatable precisely because process, unlike personality, is transferable.
Where Deals Go Quiet After the Estimate Is Sent — and What Follow-Up Actually Does to Close Rates
Most hardscaping companies treat the delivered estimate as the close attempt. Send it, wait, hope. That is where a meaningful share of winnable jobs quietly disappear.
The homeowner's reality after receiving an estimate is rarely tidy. They are sitting on two other bids. Waiting to talk to a spouse about financing. Probably just busy, with your proposal sitting in an inbox next to a dozen other things. Silence after an estimate is not rejection — it is a traffic jam. The company that fills that pause with a well-timed follow-up converts friction into a conversation, and conversations close.
Mechanically, follow-up keeps your name present while competitors' proposals go stale. It surfaces price or scope objections early enough to actually address them. It creates a second moment of responsiveness that reinforces the same trust signal as the fast estimate: this company follows through. The homeowner is making a judgment about what it will be like to manage a weeks-long project with this contractor. How you handle the quiet period after the estimate is data for that judgment.
The failure mode here is familiar. Follow-up depends entirely on whoever ran the site visit and whatever their week looks like. A Monday estimate gets a Wednesday call; a Thursday estimate during a packed week gets nothing. The prospect makes a decision either way, just not necessarily in your favor.
Automated sequences, triggered from a CRM by email, text, or both, remove the bandwidth variable entirely. The prospect hears from you whether you are in a meeting or on a job site. HubSpot research shows AI-driven emails achieving 41% higher open rates than standard campaigns, with personalized sequences driving 70% more conversions than generic outreach. The channel and the timing carry real weight.
A fast estimate followed by silence surrenders half the advantage. Follow-up is where the close actually happens.
How to Use Your Current Close Rate as a Diagnostic Rather Than Just a Score
A close rate percentage tells you whether something is working. It does not tell you where the process is breaking. The benchmark becomes useful when you treat it as a calibration instrument rather than a report card.
Start with specific questions. What is your average time from site visit to delivered estimate? Compare that honestly against the two-hour versus next-business-day split in the NALP data. That number alone tells you whether speed is the binding constraint. What percentage of sent estimates receive a follow-up contact within 48 hours? If the honest answer involves the phrase "it depends on how busy we are," that is your constraint. Where in the funnel are deals going quiet: before the estimate, after it, or after the first follow-up? Are there patterns by project size, lead source, or which team member ran the site visit?
A close rate below 20% on mid-range projects almost always points to estimate speed or follow-up cadence rather than price. A close rate sitting flat around 30 to 40% typically means the basics are executing but the upper range of performance is being forfeited through inconsistency, not through any single obvious failure point.
Referral leads are a useful calibration device here. If your referral close rate is significantly higher than your cold-lead close rate, the process is fundamentally sound. You know how to close. The gap is that the trust signals present in a referral context — speed, organization, follow-through — are not being replicated for cold leads. That is a transferable problem. Fix the replication and the gap closes.
The Revenue Math When Close Rate Moves From Average to Top-Performer Range
Hardscaping is a forgiving category for this kind of improvement because each won job carries real weight. The compounding effect of a higher close rate is substantially larger here than in a trade where the average ticket is a few hundred dollars.
Run the math simply. A company doing ten site visits per month, with project values in the $15,000 to $30,000 range, moving from a 25% close rate to a 45% close rate wins two additional jobs per month. No new leads. No marketing spend. No additional crew. Two more jobs per month from the same pipeline, which at those project values compounds into several hundred thousand dollars in additional annual revenue attributable entirely to process change.
The constraint for most hardscaping companies is not lead volume. Site visits are happening. Prospects are showing up. What is missing is winning the proportion of those visits that a tighter process would produce.
One lever that frequently goes unpulled at the estimate stage is financing. Jobber's 2025 State of Home Service report found that a substantial majority of home service projects above a few thousand dollars are financed by the homeowner. Presenting financing options inside the estimate removes a common stall point at precisely the moment the prospect is most engaged. For higher-value hardscaping projects, that is frequently the difference between a deferred decision and a signed contract.
The systems that produce top-range close rates — fast estimates, automated follow-up, consistent presentation — are operational infrastructure and they scale. An owner who fixes close rate is simultaneously building the process capacity to absorb more volume without proportional overhead. The 25-point gap in the NALP benchmark is not about sharper salesmanship or better pricing instincts. It is about being present and organized during the narrow window when a homeowner is ready to say yes.